As an alumnus of a Kansas high school, I was interested in researching which factors strongly influence standardized test performance at Kansas mid-size to large (4A-6A) high schools. To conduct this research, I visited several databases—primarily the Kansas State Department of Education (KSDE) Data Central Database—and collected recent data. Next, I utilized Microsoft Excel to analyze the data through correlations and pivot tables and used Tableau to create data visualizations.
From my data analysis, I found evidence that high school students who are economically disadvantaged also tend to face a disadvantage on standardized tests. The data demonstrates that socioeconomic status is a key indicator of Kansas high school students’ performance on standardized tests, including the Kansas state assessments and the ACT. Below is the data story I wrote on this topic for the class JMC 309: Data Storytelling in fall 2022 at the University of Kansas.
“Standardized” test performance reveals an unfair standard
Low-income high school students face a disadvantage on standardized tests, according to recent Kansas data
“I was definitely very stressed about the ACT.” Anna Wiksten, a senior at the University of Kansas, recalls the pressure she felt when she took the ACT, one of the nation’s most popular college entrance exams, while she was a student at Hayden High School in Topeka, Kansas. “I definitely put a lot of stress on [standardized tests] because I was like, okay, if I need to get into college, I have to take this test.”
As over a million U.S. college-bound students do each year, Wiksten took steps to prepare herself for the ACT. Her parents, both college-educated, encouraged her to use an ACT preparation book that they had purchased and even gave her the opportunity to see an ACT tutor every weekend. This enabled Wiksten to see an improvement in her ACT score.
Unfortunately, not all high school students have access to tutors or practice resources as they prepare for standardized tests, including college entrance exams, often due to financial barriers. As a result, high school students who are economically disadvantaged also tend to face a disadvantage on standardized tests.
A lack of equal chance to perform well on these tests is not only a national issue; it is also a local one. In fact, a dataset of Kansas mid-size to large (4A-6A) high schools, created using recent data from the Kansas State Department of Education (KSDE) Data Central database and other sources, demonstrates that socioeconomic status is a key indicator of Kansas high school students’ performance on standardized tests. These tests include the Kansas state assessments and the ACT.
“I don’t know if [students with different backgrounds] would even know [about] having an ACT tutor,” Wiksten said. “That was a privilege that I was able to get.”
Data shows that economic disadvantage leads to lower scores
Kansas 4A-6A high schools with more students that are economically disadvantaged tend to have lower ACT and state assessment scores.
For example, there is a high negative correlation, or relationship, between the percentage of economically disadvantaged students in a high school and the school’s average ACT score. As shown in the scatterplot below, this negative correlation is approximately -0.84 (on a scale from 0 = no correlation to -1 = the strongest possible negative correlation) for Kansas 4A-6A high schools.

There is also a high negative correlation between the percentage of economically disadvantaged students in a high school and the percentage of students at that school who perform well on state assessments on average across subjects. At the high school level, there are three tested subjects: English and language arts (ELA), math and science. Here, “performing well” has been defined by scoring at a level 3 or 4 (For the Kansas state assessments, level 1 is the lowest possible score level, and level 4 is the highest possible score level).
For 4A-6A Kansas high schools according to recent data, the negative correlation between economic disadvantage and performing well on state assessments is approximately -0.8.

These correlations reveal how significantly economic disadvantage plays a role in standardized test performance. They indicate how individual students may be at a disadvantage based on their socioeconomic status. Meanwhile, this information also shows how schools with a greater percentage of students facing economic disadvantage may struggle to compete against other schools when it comes to standardized test scores.
Free or reduced lunch eligibility has a strong negative relationship with test scores
Free or reduced lunch is a form of financial assistance offered to K-12 students in Kansas, so they can be provided meals at a low cost (or for free) during the school day if they qualify based on their families’ socioeconomic status. Because of how much economic disadvantage plays a role in standardized test performance, it may come as no surprise that schools with more students who have free or reduced lunch eligibility also tend to have lower ACT and state assessment scores.
For 4A-6A Kansas high schools for the 2020-2021 school year, the negative correlation between the percentage of students who were eligible for free or reduced lunch in a high school and the school’s average ACT score was approximately -0.84. Supporting data for free or reduced lunch eligibility used in the below analysis was sourced from the National Center for Education Statistics Public Schools database.

Likewise, there is a high negative correlation between the percentage of students who are eligible for free or reduced lunch in a high school and the percentage of students at that school who score at a level 3 or 4 on state assessments. For the same schools and year, this correlation was approximately -0.8.
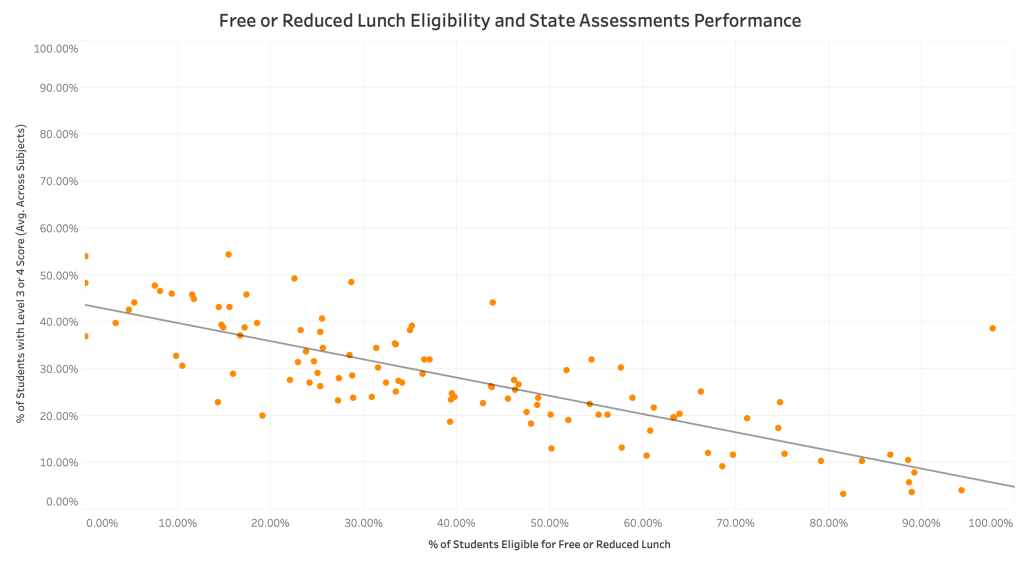
As shown on the above scatterplots, the outlier in this data is the free and reduced lunch information for the Sumner Academy of Arts and Sciences. In 2020-2021, 97.66% of students at this school were eligible for free or reduced lunch, but the average ACT score was as high as 22.15. This is likely because Sumner Academy of Arts and Sciences is a specialized magnet school.
The correlations between economic disadvantage and standardized test performance, and between free and reduced lunch and standardized test performance, are almost identical. This is no coincidence. Instead, this finding strengthens the arguments that socioeconomic status indicators are very useful for predicting standardized test performance and that low-income students face a disadvantage on standardized tests.
Title I schools underperform relative to schools without a Title I designation
Title I is a federally funded program that provides support to low-income students. Overall, 4A-6A Kansas high schools with a Title I designation had, on average, lower ACT and state assessment scores compared to schools without such a designation around the 2020-2021 school year.
The highest composite score that a student can earn on the ACT is a 36. In 2020 and 2021 combined, the average ACT score across Kansas 4A-6A Title I high schools was 19. Meanwhile, the average ACT score across same-sized schools without the Title I designation was two points higher at 21.

In spring 2021, the percentage of students with level 3 or 4 state assessment scores on average across subjects was 23% for Kansas 4A-6A Title I high schools on average. However, it was 11 percentage points higher (34%) on average for same-sized schools without the Title I designation.

Takeaways for students and educators
The evidence from recent data shows that socioeconomic status has a powerful impact on students’ academic performance, specifically on standardized tests. This outlook may appear bleak for students and educators. The data suggests that standardized college entrance exams such as the ACT do not provide a level playing field for students of all backgrounds.
This data also indicates that certain schools have an advantage when it comes to performing well on state assessments. Specifically, those who have students with higher socioeconomic status on average are more likely to have higher scores.
What can students and educators do with this information? High school students can become their own self-advocates and look for any affordable and available opportunities to attain extra practice for standardized tests. This could include looking online for free practice resources or reaching out to high school teachers, administrators or college counselors to see if their high schools offer testing resources such as review sessions or reduced testing fees.
Meanwhile, educators can look for more opportunities to help students of various socioeconomic backgrounds prepare for standardized tests. Kate Thornton—the principal of Chapman High School, a former administrator of Junction City High School and a former English-as-a-Second-Language (ESL) teacher at Salina South High School—shared how her variety of experiences as an educator have shaped her perspective regarding standardized testing.
“You begin to see biases in assessments,” Thornton said. “Students that struggle…maybe there is a language barrier, maybe there is a socioeconomic barrier…just don’t have the access that other students do, and you start to see the divide…It’s really disheartening.”
Thornton shared how Chapman High School has made efforts to try to give all students the opportunity to succeed on the ACT. In recent years, Chapman High School has required freshmen to take the PreACT, has provided a free ACT testing opportunity to juniors and has offered ACT prep classes. The school has implemented curriculum changes to be strategic about aligning coursework with the learning standards that are tested on the state assessments.
It can be beneficial for educators to utilize school hours and include ACT practice in a school’s curriculum. This is partially because many low-income students work part-time to support their families or have other obligations that may limit how long they can spend on test preparation after school hours. Students may also have limited access to practice materials due to the expense of various preparatory books or limited Internet access at home that would prevent them from making the most of free online resources. This is why school-provided practice materials can be essential.
Economically disadvantaged students are also less likely to have personal connections that have experience with the college admissions process, including standardized testing. This is where schools can step in by providing review sessions hosted by college counselors, experienced teachers or other test experts. Students and educators may also choose to advocate for changes at local colleges and universities that include a more well-rounded approach to college admissions.
All in all, students and educators must proactively advocate and strive for better outcomes for themselves and for their schools. This is especially true in the current circumstance in which “standardized” tests fail to represent a fair standard for all students regardless of socioeconomic status.
More information about the data
Click here for more information about this article’s supporting data and analysis.
